Enhancing the safety of a scout camp‘s temporary water network with BactoSense
- bNovate

- Aug 21, 2025
- 6 min read

The federal camp "Mova,“ organised by the Scout Movement Switzerland, hosted over 30,000 participants in Goms.
A temporary water network was established to ensure the availability of drinking water for this large-scale event. Ensuring high-quality drinking water was a priority and was achieved through a comprehensive self-control strategy involving hazard analysis, on-site monitoring, online and field measurements, and laboratory testing.
These strategies can also be deployed in real water distribution networks.
BactoSense proved itself to be a valuable tool for bacterial monitoring in drinking water network surveillance, thanks to its quick measurement cycles, compact size, and rugged housing, which are suitable for harsh environments.
A temporary network and its self-monitoring concept
The camp‘s water supply system faced numerous challenges due to its size and temporary nature. Microbiological risks were a central concern.
A comprehensive self-monitoring plan, based on the Swiss guidelines for best practices in drinking water supplies (W12), and a professionally built network were essential to manage these risks effectively.
The temporary water network covered over 9 km of pipes, delivering water from the springs of the Obergoms and Goms communities to the camp. The network was organised into
distinct subnetworks (Figure 1) with multiple surveillance points where various parameters were measured, including temperature, total cell count (TCC), aerobic mesophilic bacteria count (HPC), and specific Enterococci and E. coli counts.
The results are represented with a traffic light system. Green signifies that all parameters are OK, yellow signifies minor issues with one or two parameters, and orange and red signify a major breach with faecal indicator bacteria, the colour depending on the intensity and number of the
measurements.
In compliance with the self-monitoring concept, BactoSense, bNovate’s flow cytometer, was installed at Point H (Figure 1).
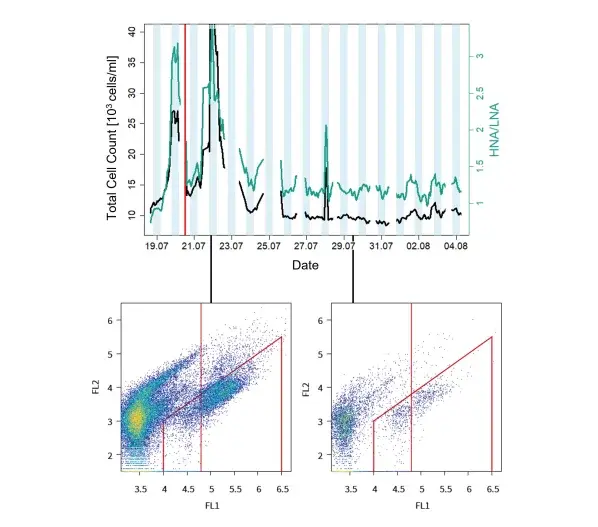
The device automatically provided continuous data on TCC and the HNA/LNA ratio (strongly over weakly fluorescing cells). In addition, manual measurements of samples from other subnetworks were performed with BactoSense, allowing for the quick, on-site determination of TCC in
cells/ml (see Figure 3).
These tests exemplified how flow cytometry offers speed and sensitivity advantages over
heterotrophic plate count (HPC) analysis for the general detection of bacterial growth.

Challenges of rapid commissioning and fluctuating use of the network
Time constraints and fluctuating water consumption patterns proved challenging for the system.
The network had to be installed and commissioned quickly, and delays in other infrastructure components impacted the network's stability. The system was released despite some areas not being fully operational, the network experienced partial water stagnation before the arrival of the scouts on 23.08.2022 (Figure 2).
Stagnation events are characterised by an increased number of cells detected and larger clouds
on the dot plot. Flushing proved to be an effective measure to counter stagnation events. The arrival of 30,000 participants caused a rapid increase in water consumption, leading to less stagnation but also to pressure drops and potential contamination risks with back-flowing water.

Complementarity between rapid detection and lab analysis
During the camp, laboratory and BactoSense samples were taken for self-control at critical control points disseminated throughout the network.
The focus was placed on areas with stagnation, endpoints, and points of consumption for sensitive consumers (emergency practices, childcare facilities). Laboratory analyses were crucial in confirming the nature of the contamination; however, on-site monitoring with BactoSense enabled quick interventions (Figure 3).
When a microbiological warning value was exceeded, an assessment of the overall situation was conducted, and measures were taken accordingly. These ranged from intensified monitoring
of a specific location to flushing sections of the pipeline, and even to emergency chlorination.
The network system could be rapidly protected through additional chlorine dosing to the incoming water, which ensured safe water consumption for the participants.

From 1 to 3 August, a contamination incident was identified (Sanitary Tract Point J), as indicated by the dot plots generated by manual sampling with BactoSense (Figure 4) and verified by lab results, confirming Enterococci‘s presence.
The uncontaminated sample displayed a typical dot plot for that measurement point, with a TCC of 12,090 cells/mL. In contrast, the second-contaminated sample showed a distinguishable secondary cluster, with a TCC of 636,140 cells/mL, indicating the presence of a contamination event.
This more than 50-fold increase in cells/ml is an indicator of issues in the water pipelines. Using fingerprinting techniques, bacterial contaminations can be compared by further analysis of the generated Flow Cytometry Standard (FCS) files, all of which consistently exhibit a shift to a different
bacterial pattern. The ability to measure TCC on-site and within 20 minutes enabled targeted sampling and follow-up measurements in the laboratory, as well as the prompt initiation of measures to ensure drinking water quality for approximately 30,000 people over two weeks.

Dot plot analysis
The analysis of BactoSense dot plots primarily focuses on two clusters: high nucleic acid content (HNA) and low nucleic acid content (LNA) bacteria (as shown in Figure 5).
Gate A contains either Total Cell Counts (TCC) or Intact Cell Counts (ICC). Standard gates provided with BactoSense typically encompass the most relevant scenarios.
Within the HNA group, there is an abundance of thriving and well-growing bacteria, including pathogenic strains. If you possess the fingerprint of potentially pathogenic bacteria, this knowledge can facilitate the early detection of contamination risks [3].
The gates effectively filter out background interference, inorganic particles and instrument noise.

Entering the era of self-monitoring
In conclusion, the successful management of the temporary drinking water infrastructure at the "Mova“ federal camp demonstrated the importance of proactive planning, self-monitoring and swift action to ensure safe drinking water.
The challenges faced underscored the need for continuous assessment and adaptation, with both on-site monitoring and laboratory analyses playing crucial roles in maintaining water quality.
Using on-site flow cytometry with BactoSense provided real-time information for effective decision-making. This experience is a valuable lesson in the effective management of large-scale, temporary water supply systems.
Benefits of Bactosense Use:
Microbial quality control of the water within 20 minutes instead of days;
Constant surveillance of the water network;
Quick response time in case of contamination;
Support of self-control measures according to guidelines;
Fingerprinting allows for contamination detection;
Rugged and compact design of BactoSense makes it possible to be deployed in harsh environments.
Book a demo today to explore how BactoSense can help ensuring safe drinking water anywhere, anytime.


Comments